Want to learn more about the solar industry? Join us for Empower 2024 on June 5-6! You’ll hear from industry experts on everything from what’s next for battery storage and VPPs, to how AI is affecting the industry, and more.

There’s no two ways about it: NEM 3.0 has been confusing to homeowners, especially when it comes to solar and battery storage.
What we do know is that in the first quarter of 2023 there was a huge push for homeowners to get grandfathered into NEM 2.0 before NEM 3.0 became policy for new installations in April, 2023. As expected, residential solar installs have slowed down since then, but that absolutely doesn’t mean solar doesn’t make sense under NEM 3.0. In fact, it’s entirely the opposite. Solar is still a great investment, and now battery storage can make even more sense for many homeowners.
The difference? In the past, battery storage has largely been a way for homeowners to have backup in case the power went out — which, with wildfires and other grid-reliability issues, is a good idea. Now, battery storage for self-consumption can actually significantly add to the return on investment for a solar system. This is another great selling point for battery storage, and a great way to attach more value to every solar system you sell.
How? And more importantly, how do we explain this to homeowners?
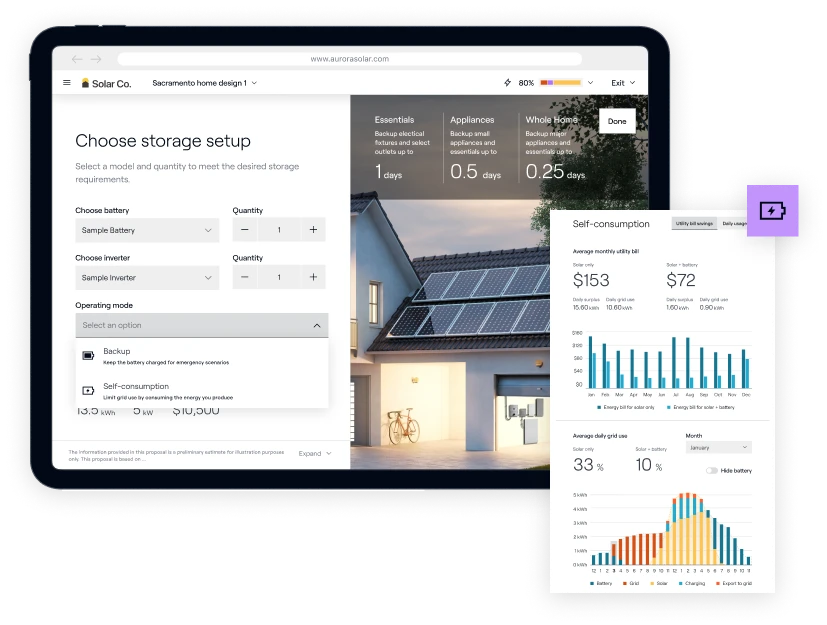
Aurora recently released a new feature in Sales Mode aimed to help: storage hourly visualizations. Using it, you’ll be able to show homeowners, in detail, just how battery self-consumption works, broken down by the hour.
Storage for self-consumption: A day in the life
First, a brief overview of how storage self-consumption works, how it works with NEM 3 specifically, and how it works with other net metering policies.
When a homeowner has their batteries set to self-consumption mode, the system is constantly monitoring how charged the battery system is — whether it’s fully charged, at its manufacturer’s minimum charge, or somewhere in between.
Then, if the solar system is producing more energy than the home is consuming at any given time, it makes a decision based on the battery’s state of charge.
If the battery is fully charged, meaning that it can’t hold any more energy, then it’ll sell that excess back to the grid. We can think of this like collecting rainwater in a big bucket to use in your garden. If the bucket is full of water, you can’t add any more, so it needs to go somewhere. In solar’s case, that excess power goes back to the grid because there’s nowhere else for it to go.
But, where it gets interesting is if the battery state of charge is less than 100%, meaning that it’s not fully charged. In this case, it’s going to use that excess energy from the solar system to charge the battery rather than selling it back to the grid. During the day, NEM 3 export rates go as low as 0 cents per kilowatt hour (kWh) — daytime usage is generally lower, and the sun is largely shining, so there’s a lot of solar available. This makes selling it back to the grid not very cost effective, to say the least. So storing this energy for later use, say in the evening when energy can cost over $.80 per kWh (yes, you read that right) really adds up.
Selling solar storage for self-consumption
Battery storage obviously adds to the upfront cost of a system. This means showing a homeowner the potential return-on-investment in a clear, easy-to-understand way is critical to attaching it to a sale. This is where storage hourly visualizations can really help. Let’s take a look.
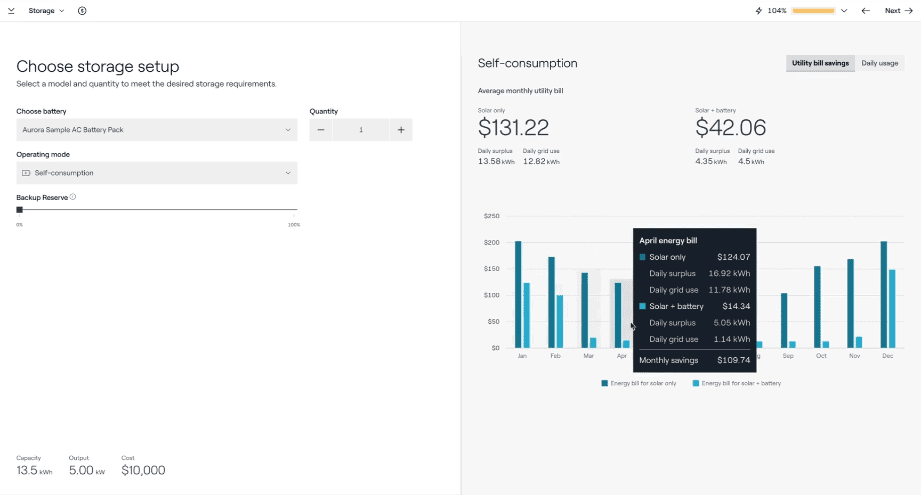
In Sales Mode, this chart shows the homeowner their utility bills with solar only versus solar plus batteries, so they can make a side-by-side comparison of whether adding a battery would reduce their bills. You can click in and show them any month of the year, as well.
But, we have to remember that storage can be a big investment, so what if the homeowner remains skeptical? This is where daily and hourly usage can be a great educational tool.
In Sales Mode
Once you click on “Daily Usage” you can select any month of the year, and it will show how much electricity, on average, the customer is pulling from the grid with solar only versus solar plus batteries. Let’s first look at August as an example. In August, with solar only, the homeowner is still pulling 51% of their power from the grid on a daily basis, but with a battery system that goes down to 0%. (You can also see that there’s a “Hide battery” toggle, so you can show how things look without battery storage.)
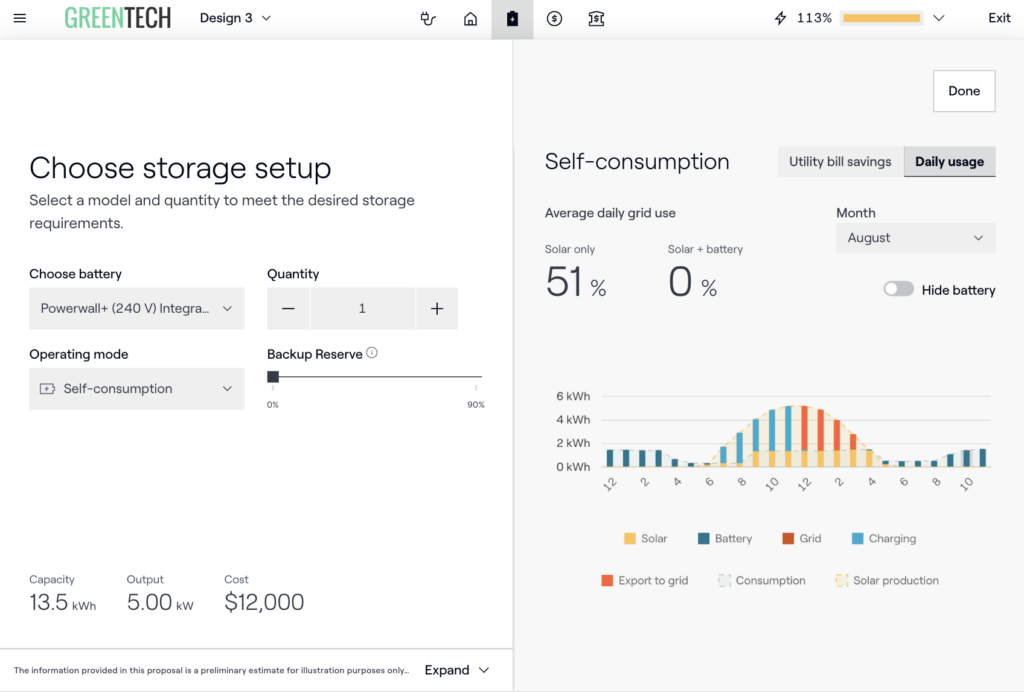
This is quite a change, and the chart clearly shows how it happens.
We can see that at around 6 or 7am, as the sun comes up, the solar system starts producing electricity, and the homeowner is using that to power their home. Even at this point, the system is producing more electricity than the home is using. But, instead of exporting that power to the grid for a very low price, it’s being used to charge the battery for later use.
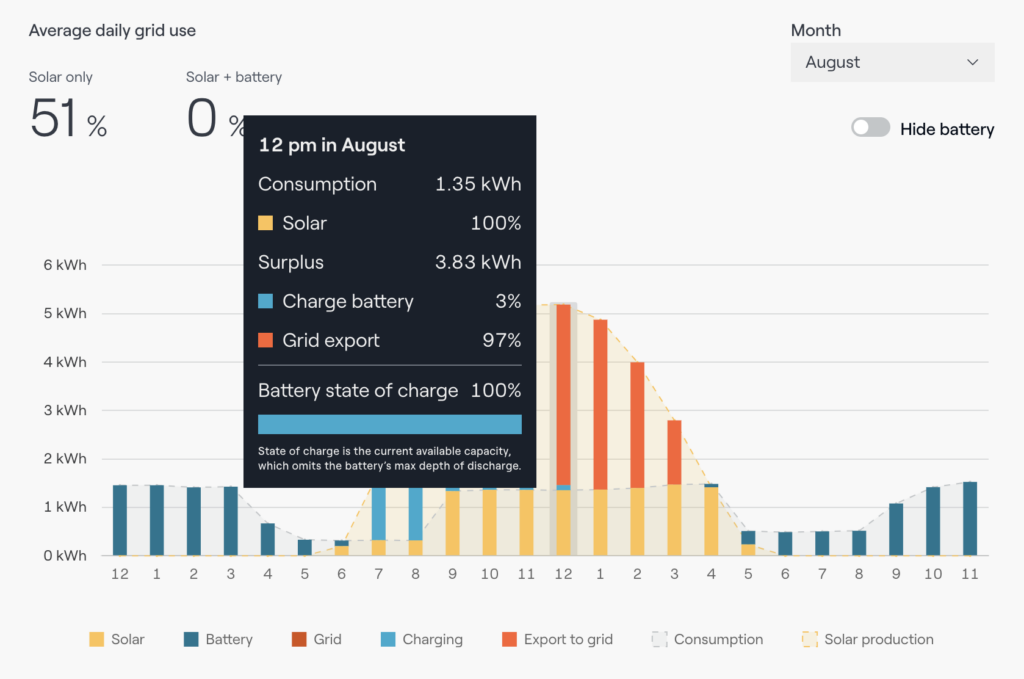
Once the battery is fully charged — between 11am and noon here — then the system starts exporting power back to the grid. We see the grid usage savings start coming into play around 5pm when the sun is low in the sky and the system stops producing electricity. Rather than buying electricity from the utility, the homeowner is instead using the power from the battery that was charged earlier in the day with solar. The homeowner keeps going on battery power until the morning of the next day, when the cycle repeats.
Sales Mode also lets you click in to any time during the day to give the homeowner more detail. For example, if we click in at noon in August, we can see specifically that all 1.35 kWh of consumption is covered by solar. Then, there’s a 3.83 kWh surplus of solar being generated, 3% of which is topping the battery off to 100%, and 97% of which is being exported to the grid.
Of course, this is during the summer in California when the sun is shining for many hours. As we get later into the year, the sun doesn’t shine for as long and it gets cloudier. So, if we go to December, we can see that the homeowner will be using electricity from the grid even with a battery. The homeowner is still able to power their home with solar and charge their battery, but will pull about 40% of the electricity needed to power the home from the grid.
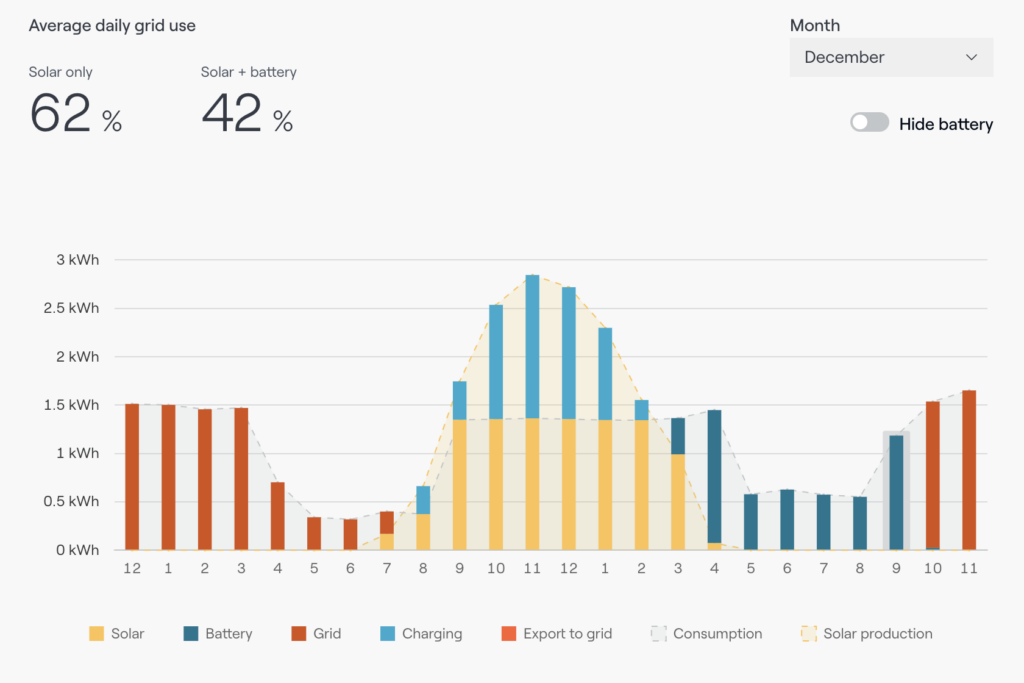
This explains why the homeowner will still be paying a utility bill with solar and batteries. But, because of NEM 3.0 policies in California, it’s a lot less than solar alone — instead of exporting excess power to the grid during the day for a very low rate, the homeowner uses that power to charge their battery.
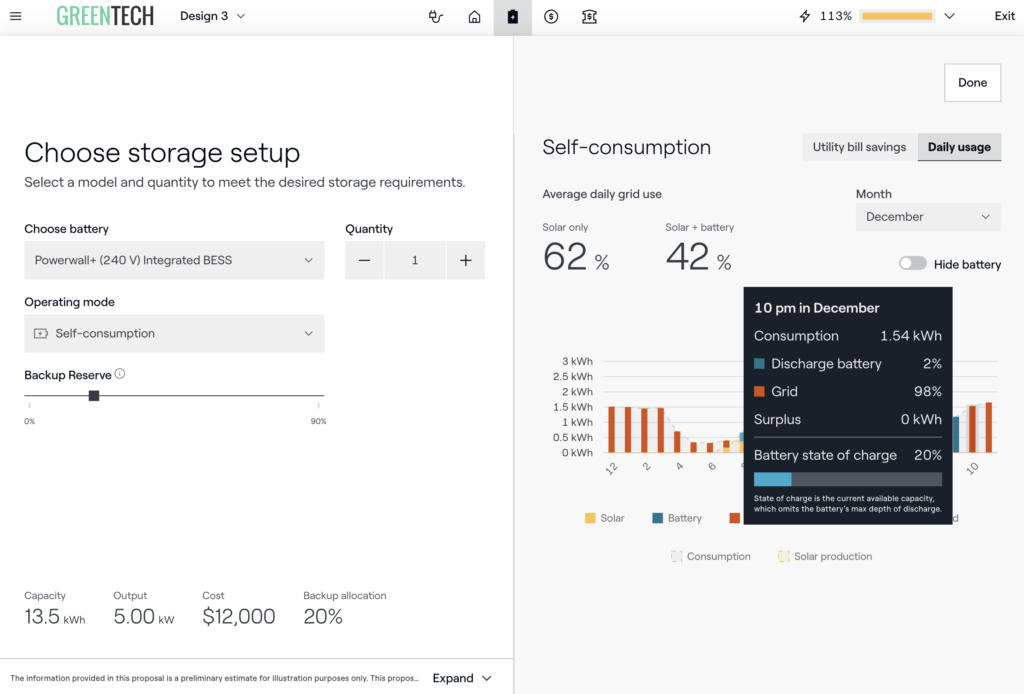
Of course, homeowners may still want to reserve some battery power for backup when the power goes out. Sales Mode lets us consider that scenario, too, and show them how that would impact their utility bill. If we kick up their backup reserve to 20% we can see that it slightly increases their utility bill. That’s because they’re always reserving 20% for backup — once the battery is drained to about 20%, then the house will start pulling electricity from the grid.
In closing…
As solar professionals, we know that battery self-consumption can be a big win for solar customers under NEM 3. It’s also understandable that homeowners might balk at the added upfront cost of that battery storage.
Hourly consumption modeling in Sales Mode lets you explain the ins and outs of just how self consumption works and why it saves the homeowner money, in a visual, easy-to-understand way.
Want to learn more about the reimagined Sales Mode? Check out our webinar, where you’ll get a demo and a run down of all the new features.