Understanding PV System Losses, Part 3: Soiling, Snow, System Degradation
Want to learn more about the solar industry? Join us for Empower 2024 on June 5-6! You’ll hear from industry experts on everything from what to expect for the rest of 2024, to how AI is affecting the industry, and more.
Register NowBeing able to give your solar customers accurate estimates of how much their solar installation will produce is essential. But there are many factors that impact how much the PV system will produce – from physical characteristics of the components and design to environmental factors like shade and dust.In order to deliver accurate production estimates, it is crucial to understand what factors reduce the energy production of your installation (PV system losses) – and by how much. In today’s article, the latest installment of Aurora’s PV System Losses Series in which we explain specific causes of solar production loss, we explore soiling, snow, and system degradation losses.
About This Series
In this series, we provide an overview of various causes of energy production loss in solar PV systems. Each article will explain specific types of system losses, drawing from Aurora’s Performance Simulation Settings, and discuss why they affect system performance. For Aurora users, this series will provide tips for improving the accuracy of your performance simulations by sharing research-backed recommendations for what values to input in your Simulation Settings for different loss types. While Aurora provides default values for these fields that fit most use cases, this series will also highlight cases in which you might want to use different values depending on the specifics of your design. (For a quick summary of system losses, and how to configure your account settings in Aurora, see the Aurora Help Center.)This guide for picking better loss values will help you give your customers the most accurate estimate of how much their system will produce and how much they can save by going solar.
Want all this info in one handy package? Download The Ultimate Guide to PV System Losses.
Click above to download our full guide to PV system losses.
Environmental Losses: Soiling
Suggested Values:
5% for regions with long dry seasons
Add 1-2% if region experiences frequent dust deposits
Add 1% if near major vehicular traffic areas
Remove 0.5% if the system will be cleaned in the summer
2% for regions with year-round rain
Commercial installers may want to consult with ground monitoring companies to create an on-site estimation of soiling, since O&M costs are in part dictated by the frequency of cleaning required.
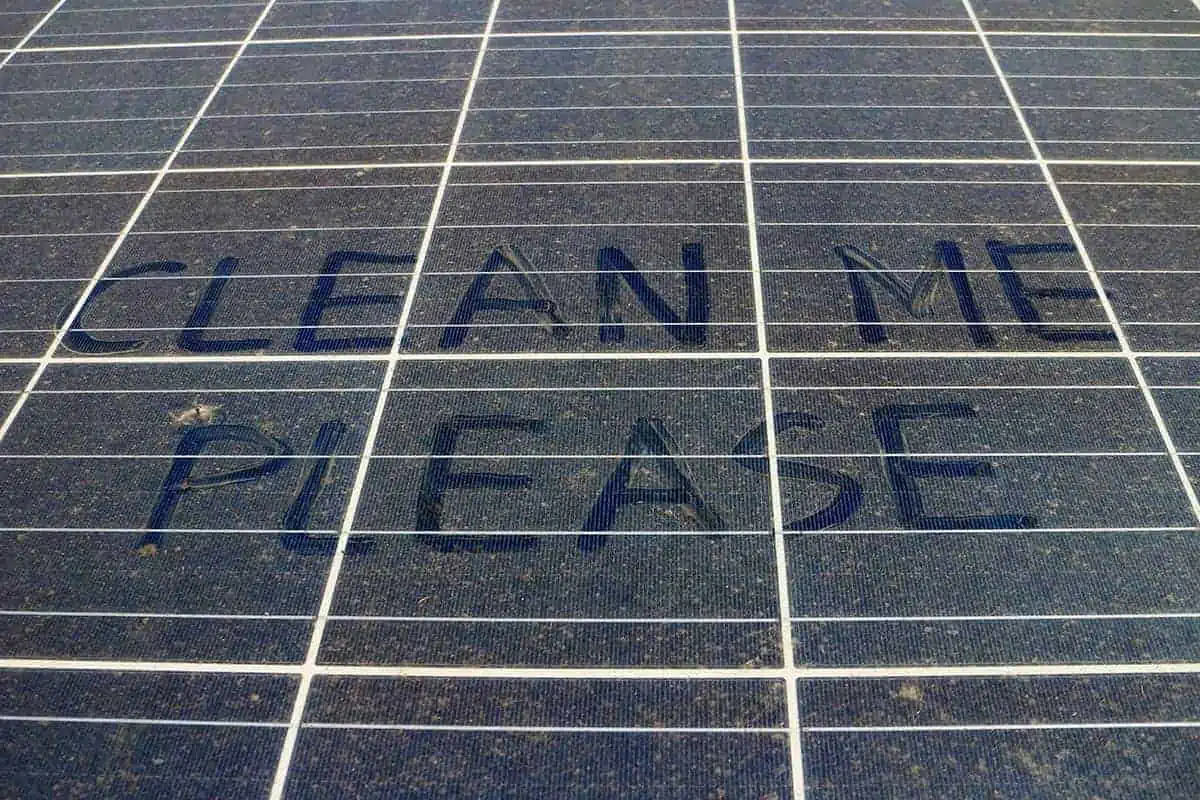
What is PV Soil Loss?
Soiling loss is when dust and grime accumulate on solar panels and other PV surfaces over time, lowering the sunlight that reaches the solar panels. Since a PV system’s performance is directly tied to how much sunlight can be transformed into electric energy, soil loss is a large aspect of calculating PV system losses. Soiling losses capture the amount of sunlight that is blocked by dirt and debris that accumulate on solar panels over time. Just like a car’s windshield, small amounts of dust and dirt can accumulate and scatter light. Soiling differs drastically based on the region that a system is located – everything from the amount of wind, exposed dirt, and local traffic, to the frequency and strength of rain and the number of birds in an area can have an effect.
Soiling Loss Percentages
Let’s start with the industry standard for PV losses, NREL’s Performance Parameters Paper. The document suggests a 5% typical soiling loss, but has a range of 2% to 25% which is incredibly wide. Let’s dig into why there’s such a large range:
Variation Across the United States
An ongoing study from the National Center for Photovoltaics tracks a number of systems across the United States with estimated soiling values. Some notable findings are that the systems scattered across central California see 4-5% loss compared with Texas plains around 1%.
Rainfall As a Major Factor
Locus Energy has a disaggregation algorithm that lets them estimate soiling losses based on production data, and they found that areas around Southern California saw very high soiling losses during summer months with a drop off in the winter. Additionally, areas in the Northeast maintained a very low soiling rate year-round. They attributed the seasonal variation in California and the consistent low soiling in the Northeast to rainfall keeping panels clean.
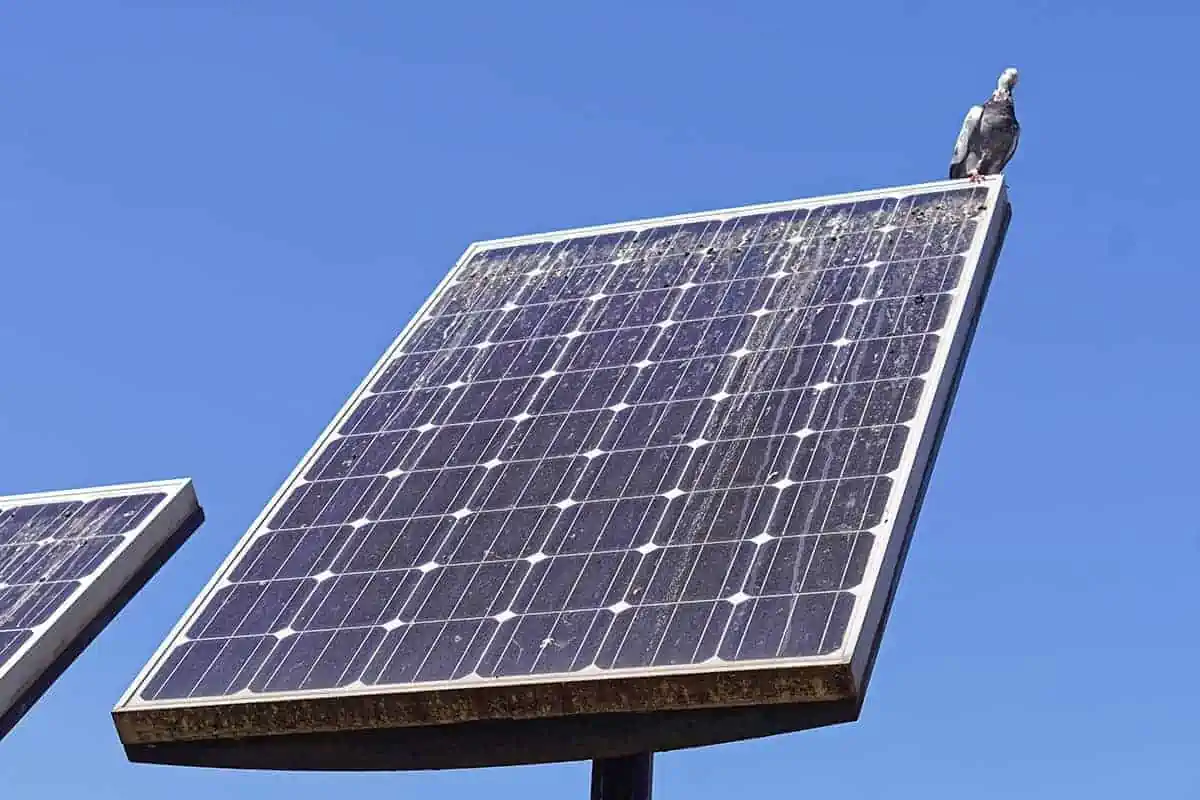
A Note on Birds
Bird droppings are typically counted under soiling losses since they represent a temporary environmental blockage in the panel, but they have some distinct behavior. First off, rain is often not sufficient to wash away the mess, and it requires manual cleaning. Unlike dirt particulate matter, it only affects one or two cells at a time but the cells it does impact are substantially blocked. Due to the series connection of cells within a panel, the one impacted cell could knock out the cell string or the entire module if bypass diodes are not present. The best advice is to clean off the panel quickly.
Removing Soiling Loss Percentages
Dust does not build up all at once – it accumulates over time, ranging from 0.01%/day up to 0.5%/day in extremely dusty areas. This means that panels should be washed periodically to prevent excessive buildup. An NREL model that uses a steady soiling increase found that, for a system that would build up soil that blocks 1.9% of sunlight over the course of a year, having one annual cleaning would maintain the loss around 1.5%, two cleanings per year could drop the average loss to 1.3%, and three cleanings per year would reduce that further to 1.2% average annual loss.
Expert Tips for Reducing Soiling Losses
If you live in a drier climate, use spare water to gently clean panels between rainfall.
If you’re living in a rainier climate, don’t be too worried. Rain will handle most dirt.
Bird droppings will have to be cleaned manually and should be addressed quickly since just a little shade can knock out an entire string.
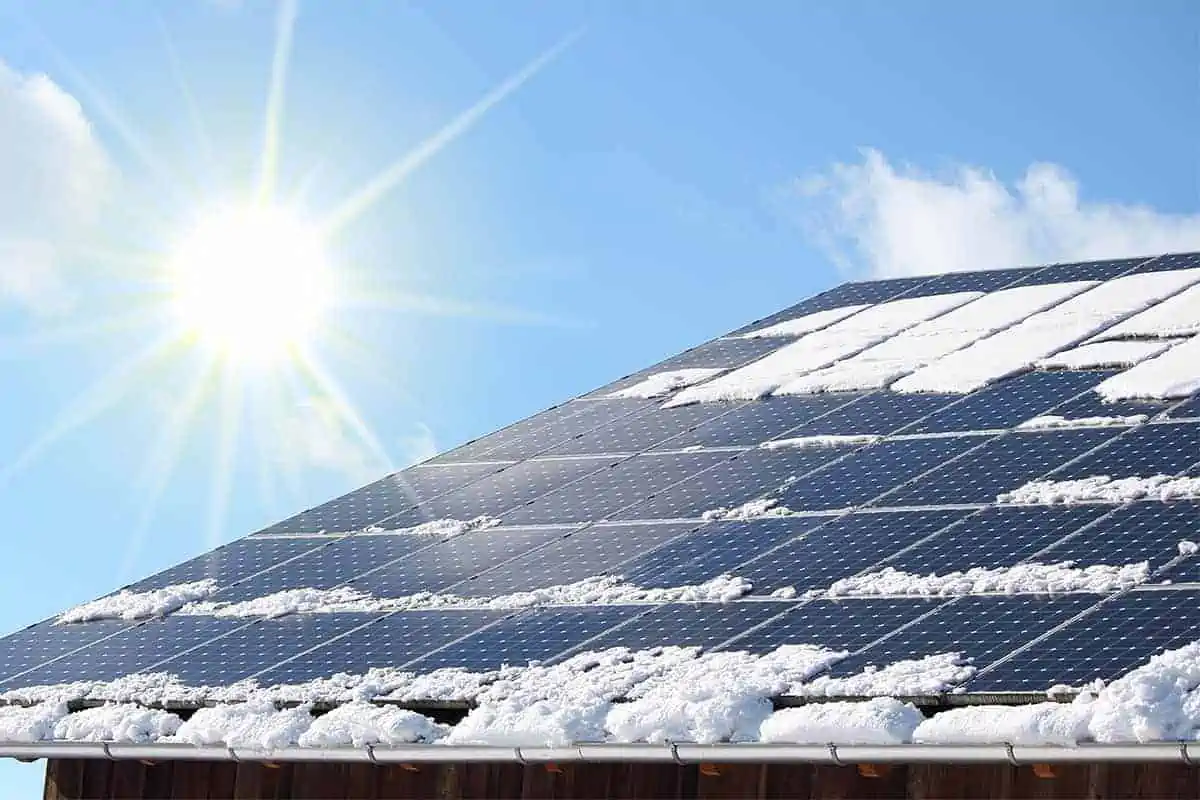
Suggested Values:Snow loss is tricky since it is very dependent on the site. We suggest using monthly snow loss factors rather than annual. Snow loss can reach upward of 20% in some regions during winter months. An NREL study that quantified snow losses with a snow-removal model calculated losses ranging from 10-30% for fixed-tilt systems. For location-specific guidance on loss values in the U.S. see our related article Your Guide to Monthly Snow Loss Values from NREL.
What is Snow Loss?
Snow cover blocks sunlight from reaching the solar panels. In snowy climates, the amount of snow loss will be dependent on several factors, including the tilt of the panels, duration and intensity of snowfall, ambient temperature, and possibly wind. Similar to how inverter shutdowns will entirely shut down a system (as discussed in Part 2), snow cover will block production until it either slides off the panels or melts away.
How to Solve PV Snow Loss
NREL studies suggest that sliding is the primary mechanism for snow clearing, although the application of this also requires some knowledge of how the panels will be spaced relative to the roof and whether there will be space for the snow to fall. For details on how snow loss is modeled, and specific guidance on loss values for different locations in the U.S., see our blog post on snow loss values.
Time Losses: System Degradation
Suggested Values:
0.3%/year for high-end modules
0.5%/year for monocrystalline
0.6%/year for polycrystalline
You can also use manufacturer production guarantees for a conservative estimate – for example, if a manufacturer guarantees that their panels will have 80% production after 25 years, that is 20%/25 years = 0.8%/year degradation.
What is System Degradation
As with anything technical, the materials in solar cells lose efficiency over time. This is known as system degradation.A standard silicon solar panel consists of silicon wafers, connecting busbars, encapsulant material, glass, and polymer backing sheets, and other electrical connection components. Over time, these components will be worn down and damaged by the effects of thermal expansion and contraction, UV light, and damage from windblown particles. Weaker electrical connections cause resistive losses within a cell, decreased shunt resistance allows current to “leak” within a cell instead of being used to power loads, and discoloration and damage to the layers in front of the cells reduces the available light.Studies on this topic are numerous since the lifetime degradation of a module and an array determines how profitable a project can be. Degradation of silicon panels depends on the type of wafer (monocrystalline or polycrystalline), the temperature of the installation site, and the materials used in the construction of the panels. Individual manufacturers also recommend certain settings for their own products.To account for this, Aurora models the reduced power output over time when analyzing the lifetime value of a project.
In Aurora, system degradation losses are accounted for at the financing stage. To see how to add a financing option to your project, see this video (0:58 shows the system degradation setting).
This article is part of Aurora’s PV System Losses Series. Each article explains specific types of system losses, drawing from Aurora’s Performance Simulation Settings, and discusses why they affect system performance.
 Being able to give your solar customers accurate estimates of how much their solar installation will produce is essential. But there are many factors that impact how much the PV system will produce – from physical characteristics of the components and design to environmental factors like shade and dust.
In order to deliver accurate production estimates, it is crucial to understand what factors reduce the energy production of your installation (PV system losses) – and by how much. In today’s article, the latest installment of Aurora’s PV System Losses Series in which we explain specific causes of solar production loss, we explore soiling, snow, and system degradation losses.
Being able to give your solar customers accurate estimates of how much their solar installation will produce is essential. But there are many factors that impact how much the PV system will produce – from physical characteristics of the components and design to environmental factors like shade and dust.
In order to deliver accurate production estimates, it is crucial to understand what factors reduce the energy production of your installation (PV system losses) – and by how much. In today’s article, the latest installment of Aurora’s PV System Losses Series in which we explain specific causes of solar production loss, we explore soiling, snow, and system degradation losses.