[This article was originally published in Solar Power World.]
The Levelized Cost of Energy (LCOE) is one of the residential solar industry’s most commonly used metrics. However, it is also one of the industry’s most poorly understood and incorrectly calculated metrics. Some may have referred to it as the “solar rate” or the “solar cost of energy.”
Most conventional LCOE calculations incorrectly overestimate the cost, making solar seem less compelling than it should be.
Whether you design a sub-optimal project, or you under-sell what you are designing, you are leaving money on the table.
The Equation
At its most basic level, the Levelized Cost of Energy is the lifetime cost of a solar installation, divided by the amount of energy the installation generates.
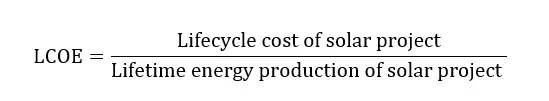
By taking into account the upfront cash payment, as well as lifetime O&M and financing costs, the LCOE is supposed to give an “apples to apples” comparison of going solar versus staying 100% on the grid [1].
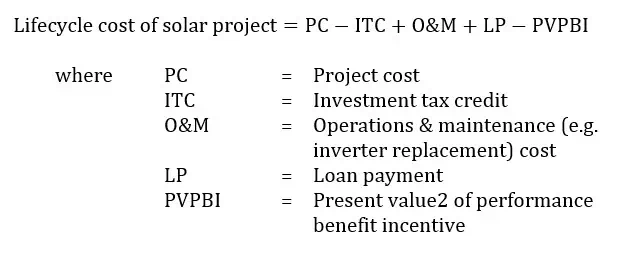
To explain this better, let’s expand the numerator of the LCOE equation:
Lifecycle cost of solar project = PC – ITC + O&M + LP – PVPBI
where:
PC = Project cost
ITC = Investment tax credit
O&M = Operations & maintenance costs
LP = Loan payments
PVPBI = Present value of performance-based incentive
So far most of this should be fairly intuitive. The more expensive the project (PC) and the higher your costs to maintain (O&M) and finance (LP) it, the higher your LCOE. Your investment tax credit (ITC) reduces your project cost, so that reduces your LCOE.
Watch Out for Performance-Based Incentives
Pay attention to the term “Present Value of Performance-Based Incentives.” Miscalculating this metric could cause money to leak out of your, and your client’s, pocket. It could contribute to increased carbon emissions by causing you to undersize your solar project, and by reducing your chances of convincing your customer to go solar.
Performance-based incentives (PBIs) are payments that are tied to your solar project’s energy production. In the U.S., the most common form of these is Solar Renewable Energy Credits (SRECs). At the time of writing, ten states have active SREC programs or markets. SRECs are tradable commodities that represent the energy generated from solar, which can be used to meet renewable portfolio standards (RPS).
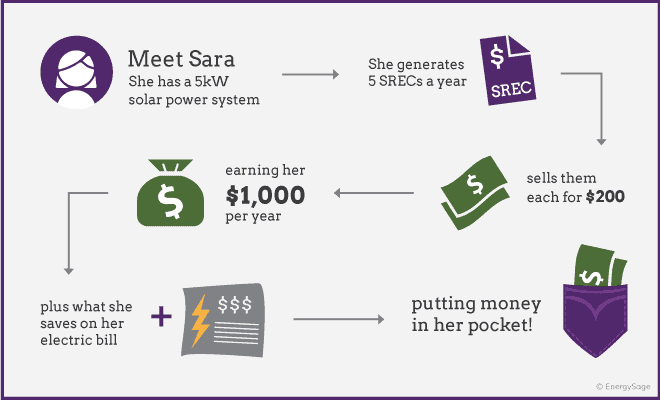 An example of how solar renewable energy credits work from Energy Sage.
Carbon credits are another type of PBI. Most home and business owners monetize their PBIs by selling them [2]. The actual value the homeowner receives will reflect the present value of the expected PBIs.
How Much Do Performance-Based Incentives Really Matter?
The effects this will have on your project’s LCOE vary based on the SREC program. Let us examine a homeowner that consumes 10,900 kWh per year. I designed a 9.9-kW system in a state where SRECs are currently priced at $0.27/kWh. Let us assume that this 9.9-kW installation has a Total Solar Resource Factor of 71% [3] .
Aurora’s performance simulation engine estimates that this design produces 10,400 kWh per year, and it will produce 320.5 MWh over the project life [4].
Let us assume further that the homeowner purchased the system (so we don’t have to worry about loan payments) at a price of $44,460 ($4.5/W). Let us also assume an inverter replacement cost of $0.4/W. The inverter is replaced once over the life of the system.
Here is a summary of the assumptions:
Project Cost = $44,460
ITC = $13,338
O&M = $3,960
LP = $0
PVPBI = $21,265
With those assumptions, the project’s LCOE excluding PVPBI is $0.11/kWh, while the LCOE including PVPBI is $0.09/kWh — almost a 20% difference! That makes a big difference in how attractive solar will appear to the homeowner.
Let us examine what effect this difference in LCOE has on the optimal system size. An optimal system size is realized when the project’s LCOE is equal to the prevailing utility rate.
The example utility in this case, National Grid, has a tiered residential rate that increases with your net energy consumption. By having a lower LCOE, you can have a bigger system since you can afford to offset both the highest and lowest electricity tiers.
| Rate ($/kWh) | ||
| Max kWh/month | Period 1 | Period 2 |
|---|---|---|
| 600 | 0.09355 | 0.10291 |
| Infinite | 0.10017 | 0.10953 |
For the example above, a 9.9-kW system offsets almost 100% of the homeowner’s energy consumption. This is not a coincidence; when your LCOE is less than your marginal utility rate, you want to offset as much of the homeowner’s energy consumption as you can. In this case, at a LCOE of $0.11, this project would not be economically feasible (hence the incentive program).
Despite its simplifying assumptions, this example illustrates how understanding all the aspects of a complete LCOE calculation will aid you in sizing solar installations. It also shows the importance of including the present value of performance-based incentives in your LCOE calculation.
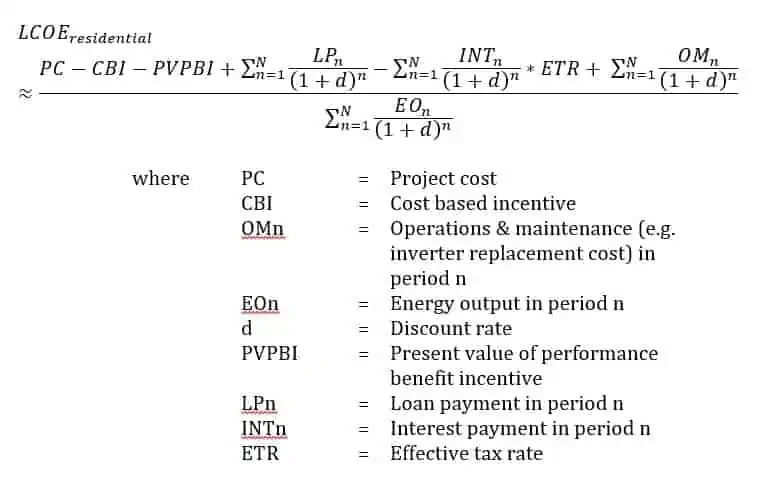
For those of you who are interested: here’s the unabridged LCOE formula Aurora uses:
Notes:
[1] This article assumes a Net Energy Metering regime.
[2] Often, the solar installer or financier will do this for the homeowner.
[3] Total Solar Resource Factor is the ratio of how much irradiance hits the roof surface, as compared to how much irradiance the roof surface would receive in optimal conditions (perfect orientation and no shading).
[4] This assumes a degradation rate of 0.5%.