COVID-19 Impacts on the California Grid
In an effort to slow down the rapid spread of COVID-19, states across the U.S. have issued stay-at-home orders and social distancing guidelines (with exceptions for essential services). California was the first to issue a stay-at-home order on March 19, 2020, and now at least 41 states have followed suit.
With most non-essential businesses and operations temporarily closed and workers shifting to working from home in California, there’s been a marked reduction in the state’s energy usage.
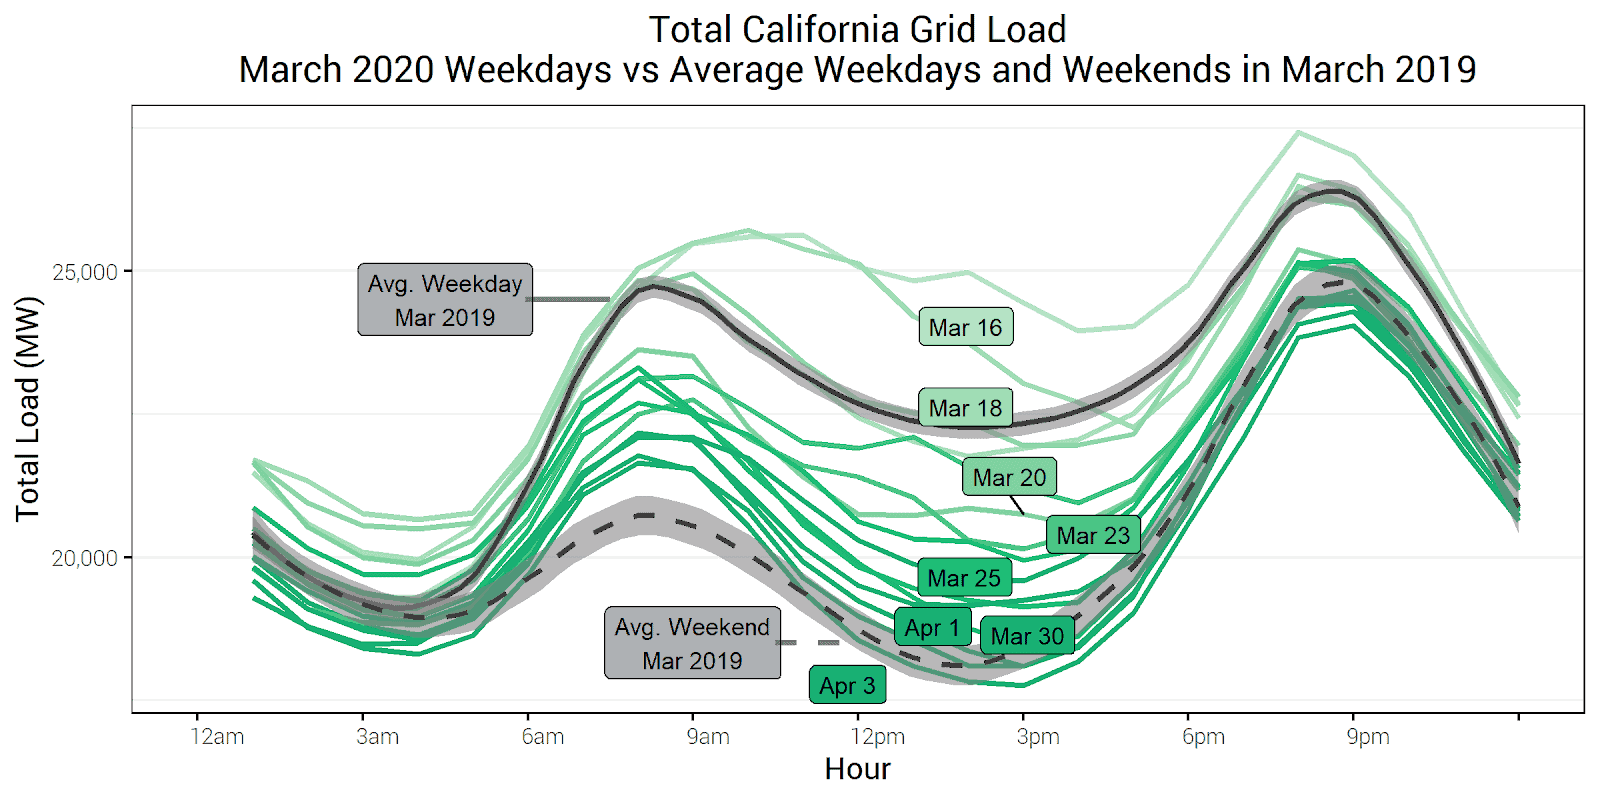
Looking at the total energy demand on the grid (or how much energy the state used) during normal business hours on the weekdays from March 16 to April 3, 2020, we can see a significant drop in mid-day demand, as well as reduced morning demand compared to the same time period last year. During the first seven days after the stay-at-home order was issued, there was a 10% reduction in mid-day energy demand. By March 30, 2020, it dropped even further to a 20% reduction.
The reduced mid-day energy demand coupled with the large amount of solar on California’s grid has raised some concerns (PDF) about solar overgeneration, best exemplified in the infamous “duck curve”. So far, the California Independent System Operator (CAISO)—the state’s grid operator—has not had to further reduce their output of renewable energy beyond the normal operation. Instead, CAISO is reducing energy imports from other grid regions and generation from wind and small hydro systems in the middle of the day. In a sense, the total load on the grid is not much different from a typical weekend, which CAISO is well equipped to handle.
Stay tuned for updates on COVID-19’s impact on California’s grid, and a deeper analysis of the duck curve this week!