Remote solar design would not be possible without good map data. Map data helps answer basic questions like how many panels can fit on a roof, as well as more complex issues like which areas of the roof are shaded and at what time of day. Aurora has always tried to give our users access to the best possible data, including HD Imagery from Nearmap and our repository of LIDAR data.
In that spirit, Aurora recently announced that we are partnering with Google’s Project Sunroof to bring better 3D and imagery data to our users. This partnership will get high quality map data into the hands of more solar installers so that designing solar becomes faster, easier, and more accurate in many regions across the US and even across the globe.
Project Sunroof uses Google’s huge repository of 3D map data to analyze the solar potential of millions of roofs. Their data covers over half of US households, and many cities across the world. Curious homeowners can go to the Project Sunroof website and check the solar potential of their roofs. Local governments can also use their data explorer to look at solar potential on a city scale so they can plan for things like grid management and incentives.
This partnership will get high quality map data into the hands of more solar installers so that designing solar becomes faster, easier, and more accurate in many regions across the US and even across the globe.

 An estimate of solar capacity in Manhattan, courtesy of Project Sunroof.
With this new partnership, installers will be able to combine Google’s 3D map data with Aurora’s CAD, shading, performance simulation and financial analysis engine. This will combine the global reach of Google’s data with the accuracy of designing a solar installation in Aurora. This will make installers’ jobs easier, and in turn help bring solar to more homes across the country.
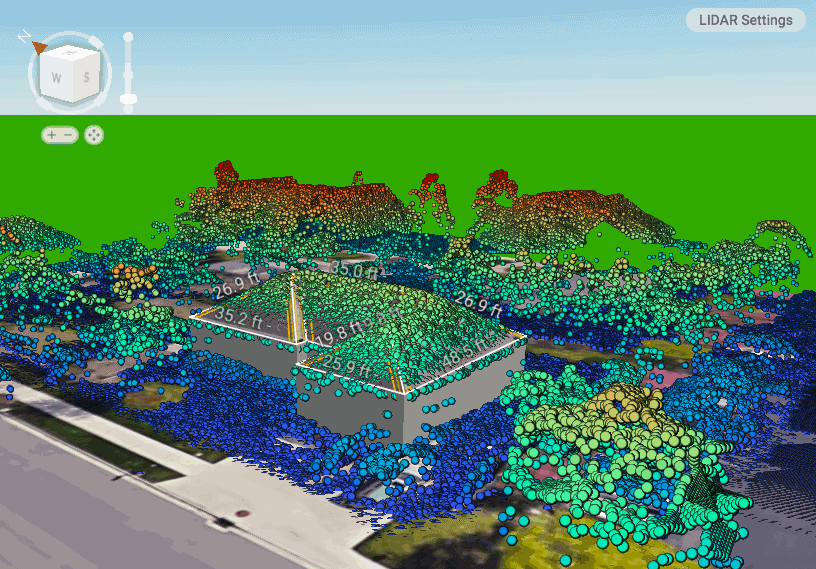 A sample of the Google 3D data available in Aurora.
Aurora users can continue to access our wide coverage of LIDAR in the US, but will now also get access to 3D data through Project Sunroof in new locations such as Reno, Phoenix, California’s Central Valley, and Chicago—as well as worldwide locations such as Paris, London, Tokyo, and Berlin.
How Google Captures Data Using Photogrammetry
You may be wondering where all of this data comes from. Google uses planes equipped with custom cameras to fly over cities and capture images from many different angles. The planes capture images from 5 different angles: straight down, forward, back, right, and left. Then proprietary algorithms combine all of these images together into a 3D model. This process is called photogrammetry, from the word photograph and the suffix -ometry, meaning to measure.
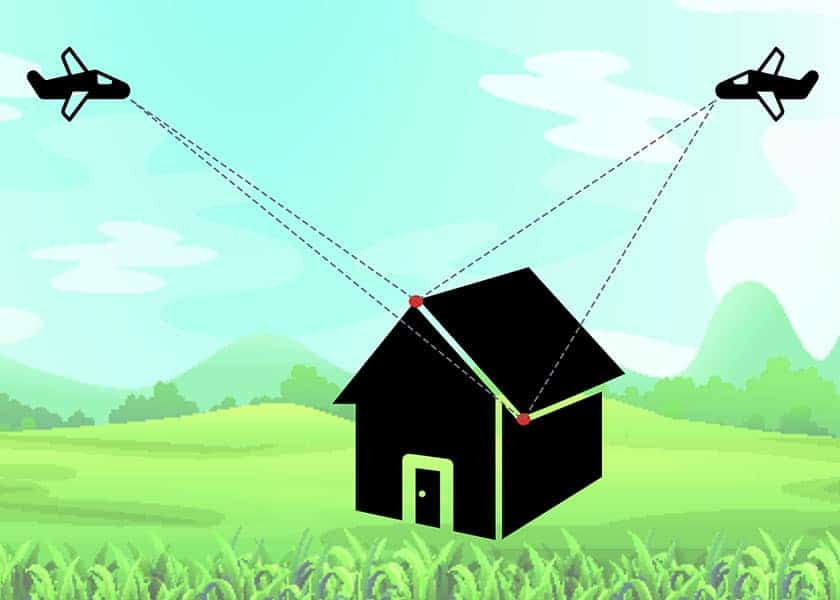 An illustration of how multiple camera angles can be used to locate points in 3D.
These photogrammetry algorithms work by looking for similar points across multiple images, for example the peak of a roof, or the end of a driveway. By combining the location of the airplane when it took the picture and where the point appears in the photo, you can figure out the actual location of the point in 3D.
Doing these calculations for a single point requires just some basic algebra. Doing it for millions of points and thousands of images across a city, on the other hand, requires sophisticated algorithms and a substantial amount of computing power. When the processing is finished, you get a full city-scale 3D model.
The final step is to add color. Fortunately, since the 3D model was generated from photos, you can get pixel-perfect alignment of the photo to the 3D scan, and you can “paint” the 3D model patch by patch with color data taken from the images, producing the full-color 3D scans that you can see in Google Maps, Google Earth, and now Aurora.
 A 3D model of Aurora’s neighborhood of San Francisco, courtesy of Google Maps.
Photogrammetry differs from LIDAR data in several key ways, including offering a number of advantages. Photogrammetry often allows you to see smaller details because pixels are closer together than points are in a LIDAR point cloud.
Additionally, photogrammetry camera equipment is cheaper than LIDAR sensors. And even if you have existing LIDAR data, for purposes like solar design, imagery is still needed on top of it, which adds to the cost. When you are trying to operate at a global scale, these cost savings add up and make it easier to expand into more markets.
Furthermore, advances in photogrammetry tend to come from algorithms while advances in LIDAR tend to come from better sensors. This fits in well with the philosophy of running smart algorithms on cheap hardware that Google used to be famous for.
However, LIDAR still has some advantages. The 3D measurements taken from LIDAR data are more accurate because the distance from the airplane is physically measured instead of inferred. It often takes less computational power to process as well because the data starts out in 3D, closer to the final format.
Fortunately at Aurora, there is no need to pick which technique is better—both data sources will exist side by side in our software. Aurora users can continue to access our wide coverage of LIDAR in the US, but will now also get access to 3D data through Project Sunroof in new locations such as Reno, Phoenix, California’s Central Valley, and Chicago—as well as worldwide locations such as Paris, London, Tokyo, and Berlin.