Solar for beginners guide
Welcome to the first installment in our 6-part series on Solar Basics 101, updated in late 2024 with the latest information. This comprehensive solar 101 series explores the key drivers behind the technology’s rapid growth. It also delves into many of the most important considerations when designing and customizing new solar photovoltaic (PV) systems from the ground up — including financing, shading, and how best to optimize your customers’ savings based on their energy bills and properties’ solar power generation potential.
But first, it’s important to understand why solar has become so popular — as an economic growth engine, a way to mitigate climate change, and as a powerful technology to help customers lower their energy costs.
Solar industry growth and affordability
Solar power is playing an increasingly important role in the transition to a world powered by renewable energy. In just the past decade alone, the solar industry has grown by a staggering 25% annually on average. Along with (and largely aided by) this meteoric growth, solar prices have fallen by a corresponding 43% — making the technology more affordable than ever before.
In fact, a new solar installation came online every 39 seconds in the US by 2023.
The Solar Energy Industries Association (SEIA) reports that there are over 5.1 million PV installations nationwide, which is enough installed capacity to power over 35.8 million homes. In strictly carbon terms, this is equivalent to planting almost 4 billion trees or decommissioning 58 coal-fired power plants.
The chart below illustrates the correlation between the solar installed capacity and decreasing PV panel costs. It shows that the price of a solar installation has decreased by more than 40% over the past decade, while annual installations have grown during the same period of time.

In addition to helping us move away from fossil fuel, SEIA also highlights how the solar industry continues to be a powerful engine for economic growth and job creation. Just in the US alone, the solar industry employed over a 280,000 people by the end of 2023, almost doubling over the past decade.
And the growth isn’t stopping here. According to SEIA, the solar industry has set a goal to reach 30% of the US’s electricity generation by 2030.
Solar energy, power, and irradiance
Solar panels generate energy by converting the sun’s photons (or light particles) into an electric current to power homes or businesses. We use the terms “irradiance” or “insolation” to refer to the power density of sunlight on a surface. In layperson’s terms, these values represent a roof’s solar potential.
We typically measure energy in kilowatt-hours (kWh), and power (the rate at which energy is produced) in kilowatts (kW).
Energy = Power x Time
1 kWh = 1 kW x 1 hour
In solar, we usually define the size of a PV installation in terms of its power output (in kW). And irradiance is measured in units of kWh per square meter per day (kWh/m2/d). The amount of irradiance hitting the Earth’s surface is often measured as the number of hours of “full-sun” (defined as 1 kW/m2 of solar energy). To review:
| Quantity | Units | Definition |
|---|---|---|
| Power | kW | Rate of energy production/output |
| Energy | kWh | Capacity to do work |
| Irradiance | kWh/m2/d | Hours of full-sun for a square meter each day |
Solar resource of a rooftop
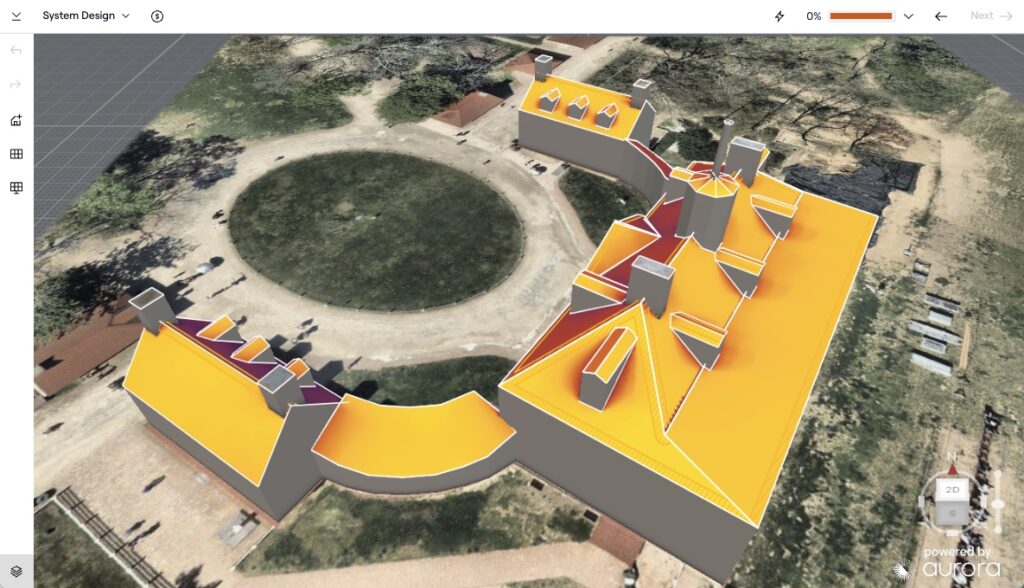
We can estimate the solar potential of a rooftop using its area and local irradiance. The US Department of Energy’s National Renewable Energy Laboratory (NREL) published irradiance data in its report: Solar Radiation Data Manual for Flat-Plate and Concentrating Collectors.
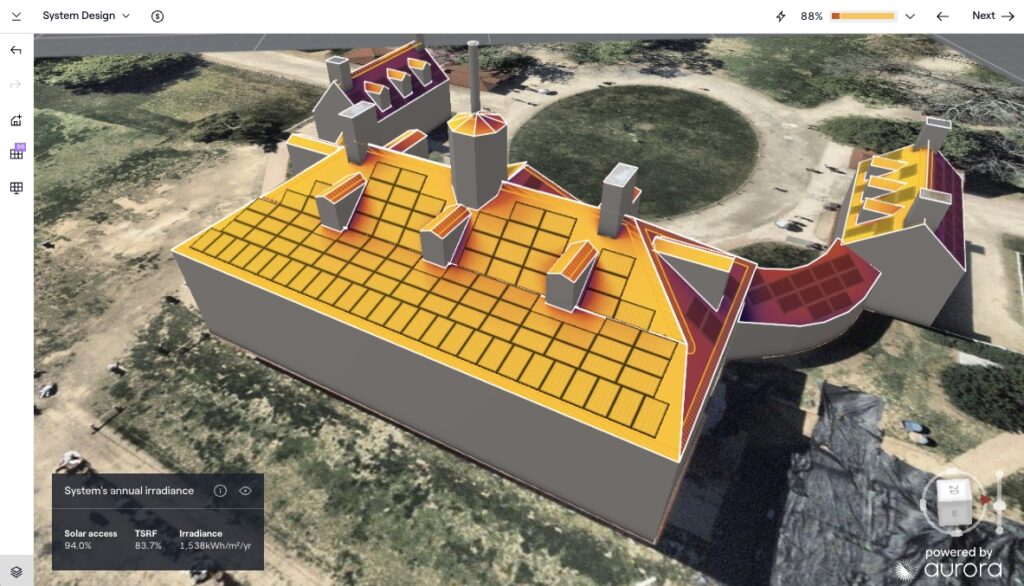
It is fairly straightforward to calculate the solar potential of a rooftop using this data. For example, a South-facing residential roof face (seen above) receives an average irradiance of approximately 1,900 kWh/m2/year. (It’s a little lower, at 1,538 here due to shading.) Dividing the annual irradiance value by the number of days in a year yields the average daily irradiance.
Average Daily Irradiance = Annual Irradiance/days/year
5.2kWh/m2/day = 1,900kWh/m2/year ÷ 365 days/year
Rooftop Energy[kWh/day] = Irradiance[kWh/m2 x day] x Area[m2]
If the rooftop has an area of approximately 150 square meters, the solar energy available is:
780kWh/day = (5.2kWh/m2 x day) x 150m2
The figure above also displays information on three additional variables related to the solar resource:
- Solar Access
- Tilt and Orientation Factor (TOF)
- Total Solar Resource Factor (TSRF)
Solar Access
This is the ratio of the actual solar energy available — taking into account shading cast by objects in the environment — to the theoretical solar energy that would be available in the absence of shading:
Solar Access = Energy with shade : Energy without shade
This is where we get the 1,538 kWh/m2/year for Mt. Vernon. For a deeper dive into what Solar Access means, be sure to review our guide on the Effects of Shading on PV Systems.
See our blog on the solar system we modeled for Mt. Vernon.
Tilt and Orientation Factor (TOF)
This is the ratio of the amount of solar energy a location actually receives to the amount it would receive if the roof were tilted and oriented optimally in a South-facing direction (when installed above the equator):
TOF = Energy with actual tilt & orientation : Energy with optimal tilt & orientation
Total Solar Resource Factor (TSRF)
This is the percentage of the available solar resource that a location receives compared to what it would receive with optimal orientation and without shading. TSRF is equivalent to Solar Access multiplied by the Tilt and Orientation Factor:
TSRF = Solar Access x TOF
About Solar PV Education 101
This blog is part of Solar PV Education 101, a six-article series that serves as an introductory primer on the fundamentals of solar. We’re updating each piece in late 2022, so be sure to check back often for the most recent information.
Part 1: The Beginner’s Guide to Solar Energy (Updated 10/2/2024)
Part 2: How a Photovoltaic System Produces Electricity (Updated 11/10/2022)
Part 3: Reading Your Electricity Bill: A Beginner’s Guide (Updated 11/15/2022)
Part 4: How to Size a PV System from an Electricity Bill (Updated 12/9/2022)
Part 5: Shade Losses for PV Systems, and Techniques to Mitigate Them (Updated 12/12/2022)
Part 6: The Basic Principles that Guide PV System Costs (Updated 12/13/2022)
And be sure to download the PDF version to give to reps, installers, and even customers looking to learn more about the basics of solar.