
Hands up if this sounds familiar. You quote a 12-panel system. A week later your surveyor gets to the site and says the layout doesn’t fit: there’s only room for 10, and a vent pipe nobody identified is sitting right where a panel was meant to go. [Hands up.]
Situations like this are obviously not the salesperson’s fault. They placed panels exactly where the design tool told them they’d fit. Now, they’ve got a situation they have to smooth over, they’ve wasted time and money, and they have to fight to keep the customer.
This is a big reason why accuracy isn’t a nice-to-have feature in design software. It’s the backbone for every number in the proposal: panel count, electricity generation, battery sizing, and, most important to the customer, payback. These kinds of surprises cost solar companies business every day, and stopping them starts with accurate, reliable data behind the design. And the data that matters most is LIDAR.
What is LIDAR and how does it work?
LIDAR stands for Light Detection and Ranging. (You’ll also see it as “LiDAR”. Why is the “A” capitalized? Nobody knows.) As the name suggests, it uses lasers to measure distance to centimetre precision.
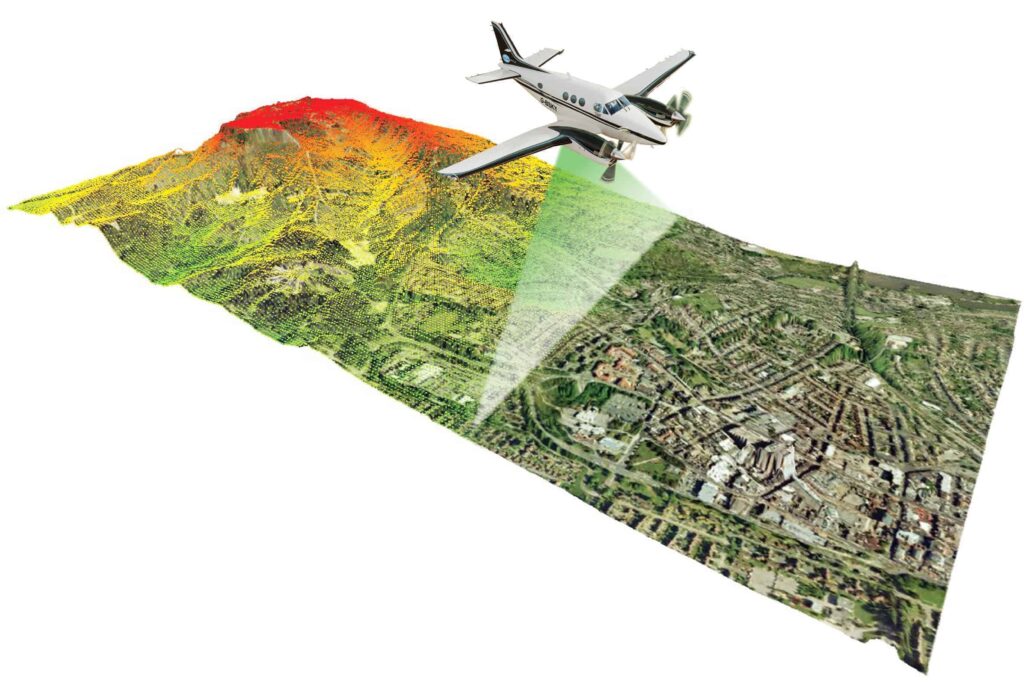
An aircraft carrying a laser scanner, a GPS receiver, and an inertial measurement unit (very basically, a device that measures velocity, orientation, acceleration, and other things) flies over an area, firing hundreds of thousands of light pulses a second at the ground below.
Here’s how it works (again, very basically):
- The sensor fires a laser pulse down at the ground
- It times the return. Light travels at a known, constant speed, so the delay between firing the pulse and it bouncing back tells you exactly how far away the surface was
- That’s the distance, calculated directly from the timing, with no estimation involved
- Millions of these measurements, combined with the aircraft’s known position, become a point cloud: a 3D map of coordinates, each one a real point in space
Every point in that cloud has a latitude, a longitude, and an elevation. It’s not an estimate of where a roof edge might be, it’s an actual measurement.
So, instead of looking at a flat image and guessing where a roof slope starts and how steep it is, or how tall a chimney is, you get real numbers: roof pitch, ridge height, eaves height, dormers, wall angles, and every obstruction on or around the building. Bang on. Measured, not guessed. Without anyone setting foot on site.
Right about now you might be asking: What is a point cloud, exactly? Great question. A point cloud is a raw measurement, not a finished model. It literally looks like a bunch of spheres in the vague shape of the surface the LIDAR measured. It’s probably easier to just show you one.
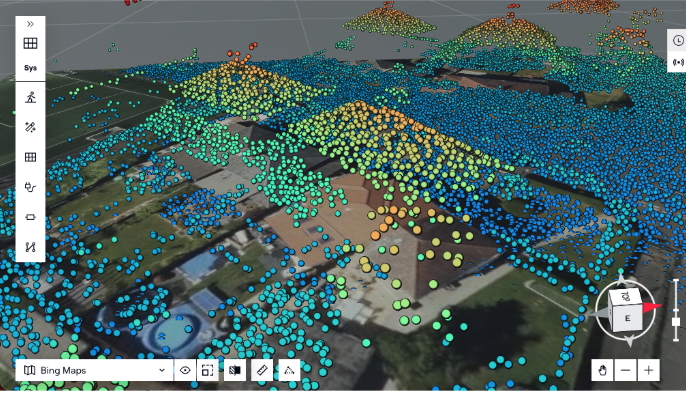
Whether a piece of software turns that measurement into an actual editable structure, or just drapes a textured surface over the top and calls it 3D, is a different question. We’ll look at that in more detail in our next post.
Why UK roofs make this matter more
LIDAR was largely proven out in markets built around detached suburban housing with fairly uniform roofs. You live in the UK, you know roofs here are… interesting. So, to say British housing throws a lot more at LIDar than a typical U.S. suburb would be an understatement.
To call out just a couple examples:
Victorian and Edwardian terraces: narrow footprints, shared party-wall ridgelines, rear outbuildings, tight clearances around obstructions.
1930s semis: hipped roof ends, chimney stacks sitting right on the party wall, loft-conversion dormers everywhere.
The details that decide a design: parapet walls, valleys, dormers, soil vent pipes, and pitch changes steep enough to throw real shade on the roof below.
A flat image collapses all of that into two dimensions. It can’t tell you whether a dark patch is a flat skylight or a brick chimney a metre-and-a-half tall. It can’t tell you if a pitch is 30 degrees or 45. That difference can mean big changes in whether the panels physically fit and how much the system will actually generate. LIDAR is how we fix it.
Three layers of a 3D model
Building a 3D model of a roof takes three main things:
Thing 1: Imagery
What it does: Shows you what’s there
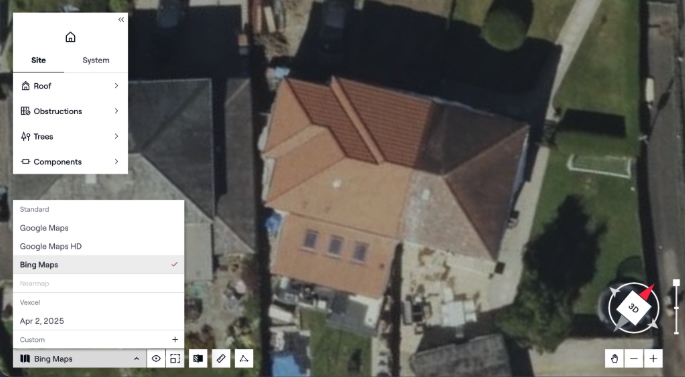
Aerial and satellite imagery identifies the roof outline and everything sitting on it: a chimney, a rooflight, a dormer, the shape of a satellite dish. It’s the initial picture of the site.
Thing 2: LIDAR
What it does: Measures exactly how tall and how precisely positioned all of it is
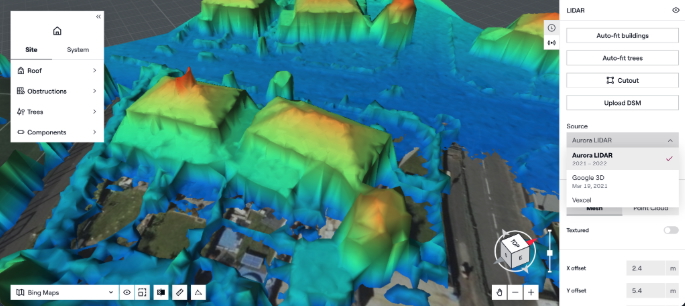
Imagery can show you a shape on the roof. It can’t tell you whether that shape extends 14 centimetres or 1.4 metres above the surface. Look at the image above. Are those 3 rectangles flat skylights or taller vents or HVAC-related. We can guess, but we can’t tell for sure. And that difference can determine whether a design fits and how much shade it throws. LIDAR is the layer that turns “there’s a chimney here” into an actual measured coordinate.
Thing 3: Parcel data
What it does: Confirms which building all of this belongs to.
On a terrace or a semi, the roofline runs continuously across several homes, and both imagery and LIDAR will happily show or measure the whole block as one surface. Parcel and property boundary data is what maps the actual title line onto that, so the model that comes out is your customer’s roof, not the one next door.
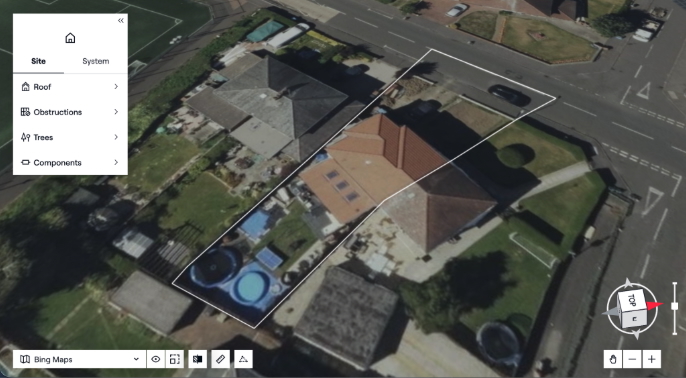
None of these three things does the whole job by itself. Imagery without LIDAR gives you a picture with no real measurements behind it. LIDAR without imagery gives you accurate geometry you can’t interpret, height data with no idea what’s actually being measured. Either one without correct parcel data might be accurately measuring the wrong building. The combination gets you somewhere a flat photo or a rough estimate can’t: a model built from what’s actually there.
Why point density and data age decide everything
Just to add another wrinkle, not all LIDAR is equal. You have to mind the gap between good and thin data, because it is enough to change your design. That’s where point density and data age come in.
Point density is how many laser points landed per square metre. The higher it is, the more detail comes through: individual obstructions, distinct pitch changes, dormer geometry, the kind of thing that actually decides where a panel goes. Sparser data can still give you the broad shape of a roof, but the finer detail starts to disappear. Think of a LIDAR measurement of your desk. If you get a point density of 1, you would know there’s a desk, but you’d miss a lot of detail. If you get a point density of 100, you could see your tea mug, laptop, and phone sitting there.
Data age matters just as much. UK roofs don’t sit still. Trees grow. Dormer conversions go in. A point cloud flown eight years ago might not know about either, but that won’t stop it from confidently describing a building that no longer quite exists.
And here’s the catch: No single provider is uniformly good on both, everywhere. One might have high point density data over a city centre and something much sparser over the villages 20 miles out. Another might have excellent coverage that’s simply old. Point density and age aren’t fixed properties of LIDAR as a technology. They’re details of a specific flight, by a specific provider, at a specific time, and they vary enormously depending on which one you happen to be looking at.
Why one provider is never enough
All of this adds up to a simple fact: One LIDAR provider isn’t enough. Another factor going into it is that LIDAR typically isn’t flown with solar in mind in the first place. Governments and survey firms do it for things like flood modelling, infrastructure, and mapping. Solar happens to benefit from all this data built for other jobs. Nobody was planning those flight paths around where solar installers would need coverage, hence the unevenness we discussed above.
So, if you depend on a single provider you inherit all of its gaps. That’s why Aurora pulls from a network of sources for both LIDAR and imagery, giving you the newest and densest option for every address by default. You can also toggle between available sources yourself if you’d rather check out another one.
And for a specific property where you want more than what’s available remotely, you can fly a drone yourself and convert that footage straight into LIDAR and imagery layers for that address. We’ll have more on that in the next post.
What we cover in the UK
Aurora’s current LIDAR population coverage:
| Region | Population covered |
|---|---|
| England | 99.3% |
| Wales | 99.7% |
| Scotland | 79.5% |
Quick note: That’s population coverage, not geographic coverage. Dense urban and suburban areas tend to have deep, overlapping data; rural terrain depends more on whichever flight path happened to reach it.
The foundation of the design
Nobody wants a design that falls apart on site because the model built back at the desk doesn’t match the roof’s actual layout and dimensions. That gap between what the software said was there and what’s actually there can be huge.
A design you can trust has to be built from three things: real height and shape from LIDAR, real context from imagery, and the right property boundary from parcel data. Take any one of them away and you’re just guessing. And running a business on guesses is a sure way to waste time and money.
In our next post we’ll look at the next question every installer should be asking: Is an accurate 3D model even possible without a site visit?
FAQ
Q: What’s the difference between LIDAR and a regular aerial photo?
A photo shows you what’s on the roof — a chimney, a dormer, a rooflight — but it can’t tell you how tall any of it is. LIDAR measures distance directly, using the time it takes a laser pulse to bounce back. That gives you a real height and position for every point on the roof, not a visual guess.
Q: Who actually flies and captures this LIDAR data, is it Aurora’s own dataset?
No single organisation “owns” UK LIDAR in that sense. It’s flown by a mix of government bodies (like the Environment Agency) and commercial survey providers, usually for purposes that have nothing to do with solar — flood modelling, infrastructure planning, national mapping. Aurora doesn’t fly its own planes; we pull from that existing network of sources and layer in imagery and parcel data on top, which is also why no single provider’s gaps become your problem.
Q: What happens when LIDAR data is old or thin for a specific address?
That’s exactly the gap Aurora is built to catch rather than hide. Because we pull from multiple providers rather than one, we can flag when the best available source for an address is old or sparse, and let you bring in a fresher one — including a drone flight you fly yourself — rather than quietly building a design on data that no longer matches the roof.