
Buckingham Palace is one of the most famous, most photographed buildings in the entire world. We don’t know about you, but whenever we see a building like that, our first question is always, “I wonder if it’s a good fit for solar?”
The roof on Buckingham Palace is huge and can fit thousands of panels, but just like bungee jumping or eating the hottest pepper in the world, just because you can do something doesn’t mean you should.
We used Aurora to see if solar is a good fit for Buckingham Palace, where the panels would go, and how much of their energy use the royal family might offset. The results may surprise you…
In this article:
- Estimating the energy load
- Modelling the site with Aurora
- How many panels fit?
- The shading reality
- The optimised design
- The verdict
- What this means for real-world solar design
- Frequently asked questions
Step 1: Estimating the Energy Load
Before we can design a solar system, we need to know the energy load we’re trying to offset. For a building this size, that takes some doing. Let’s go at it a couple different ways.
The floor-area approach
Buckingham Palace covers more than 77,000 square meters of floor space. That’s 775 rooms across multiple wings, including 19 state rooms, 92 offices, and 188 staff bedrooms. But, Buckingham Palace doesn’t have the energy profile of your typical 1 bedroom flat in the West End, so we can’t just multiply up a typical household’s use. Looking at more typical large historic buildings in the UK, they use roughly 50–80 kWh per square meter per year in electricity.
- Low estimate: 77,000 m² × 50 kWh/m² = 3.85M kWh/year
- Mid estimate: 77,000 m² × 55 kWh/m² = 4.2M kWh/year
That feels a little better. Let’s say it’s somewhere around 4M kWh/year, and let’s actually cross-check that against the real number.
The cross-check
The Sovereign Grant Annual Report, the Royal Household’s published financial accounts, records that Buckingham Palace consumed 4.3 million kWh of electricity from the grid annually. The floor-area estimate lands within 7% of the official figure, which is about as good as a methodology check gets.
To answer your next question, 4.3 million kWh is roughly equivalent to the annual electricity consumption of 1,200 average UK homes (at ~3,500 kWh/household). It also represents more than 40% of the entire Royal Estate’s electricity usage.
Step 2: Modelling the Site with Aurora
OK, now that we have our target, the next step is to build a 3D model of the site as accurately as possible. This is where the design process can get hairy, and where having the right tools makes a big difference.
Starting with the aerial image:
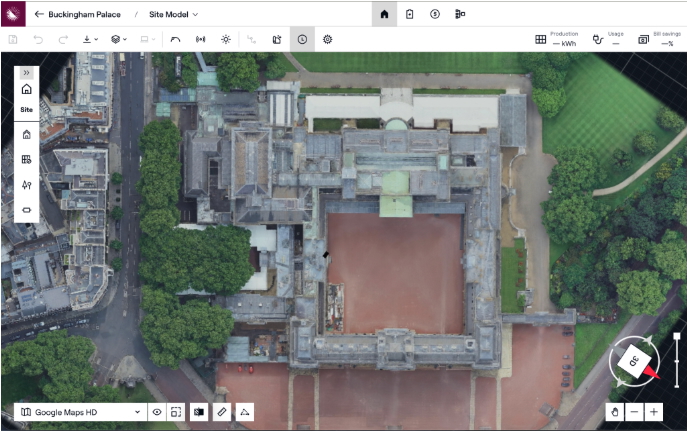
The palace presents a classic challenge (well, as much as a 775-room, literal castle can be a “classic challenge”): a complex, multi-wing roof with chimneys, dormers, flat sections, and pitched sections at a variety of interesting orientations. Pretty safe to say that a rough roof trace could introduce some serious errors in panel fit and shading calculations.
Bringing in LIDAR:
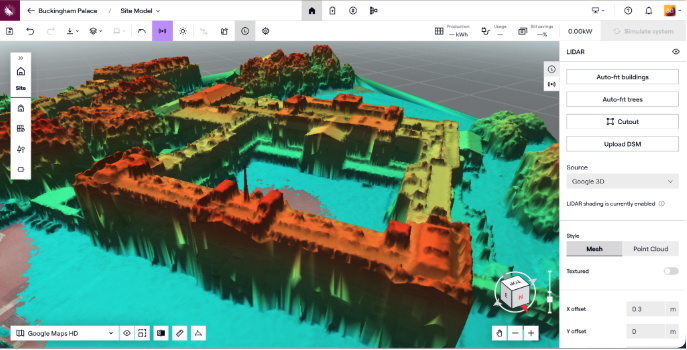
Never fear, we can use Aurora’s LIDAR integration to pull in elevation data from publicly available LIDAR datasets. in the UK, that means the Environment Agency’s 1m-resolution national LIDAR programme. This converts a flat roof trace into a precisely-pitched 3D model, capturing the actual geometry of each roof plane.
Drawing the roof with SmartRoof:
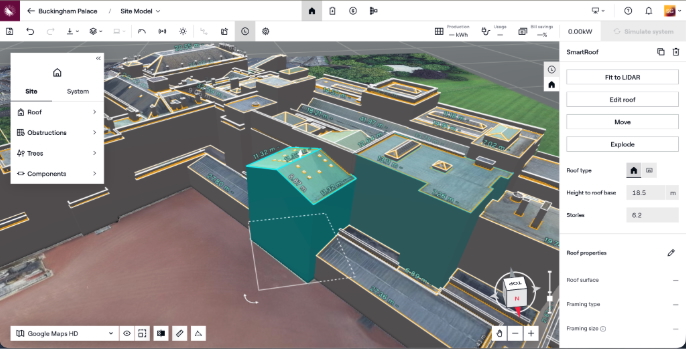
OK, we still have some serious work ahead, so let’s use another tool: SmartRoof. By simply tracing the outline of a roof, SmartRoof will automatically infer the roof structure and fit them to the LIDAR surface. For a building that’s this complex, that can be the difference between hours of manual tracing (again, likely and understandably with errors), and a time-saving model you can trust for shading calculations.
Mapping the trees:
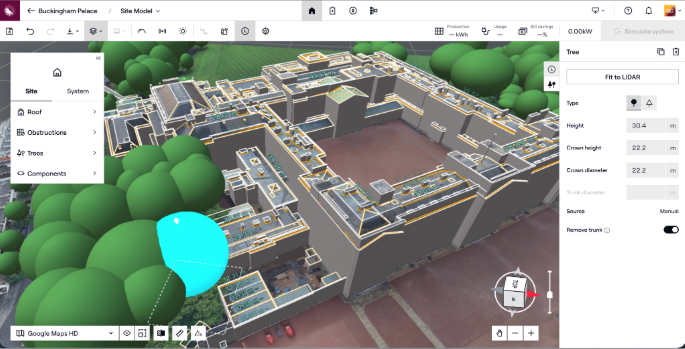
Of course, it doesn’t stop there. The gardens contain many beautiful mature trees, several of which are tall enough to cast shade onto the lower roof sections. Let’s go to Aurora’s tree-mapping tool. It places the trees as 3D shading objects, so they are captured in the simulation rather than discovered after installation.
Now we have a model we can design against.
Step 3: How Many Panels Actually Fit?
With the 3D model in hand, we can answer our first question: How many panels can we place on the available roof space?
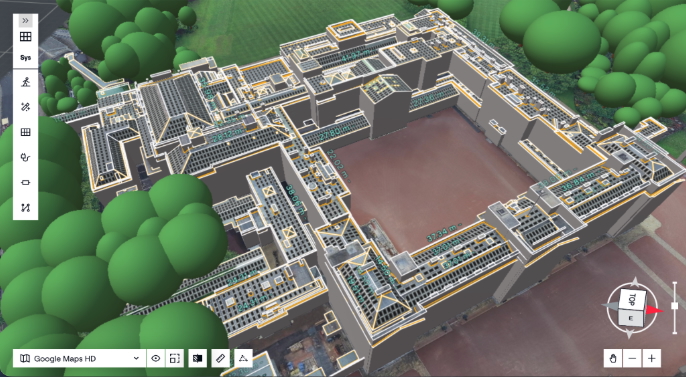
Using max fit to place panels across all usable roof space — every south, east, and west-facing plane with enough clearance — gives us:
| Metric | Value |
| Total panels | 4,605 |
| System size | ~1.5 MW |
| Roof planes used | Multiple (all orientations) |
Wow. This would no doubt be one of the largest rooftop solar installations in Central London, or even farther. And on the screen, the numbers look impressive.
But, this feels a little too good to be true. Let’s go a little deeper to see what actually works.
Step 4: The Shading Reality
Unfortunately, we know that simply placing a panel on a roof doesn’t mean it will produce enough energy to make it worthwhile. For a literal castle surrounded by trees, chimneys, parapets (yep, that’s right, parapets), and other structures, shading losses will no doubt make some roof sections a no go.
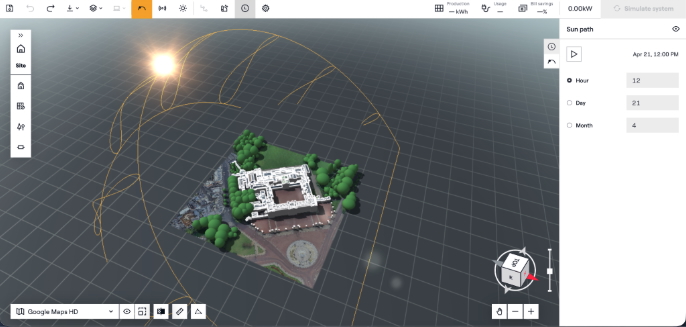
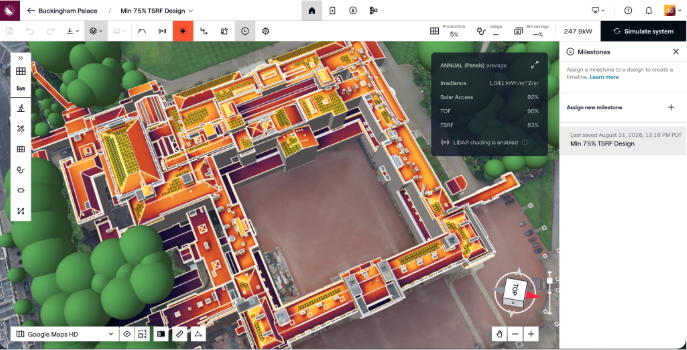
So, we’ll run Aurora’s shading analysis to get a full annual simulation. It calculates the Total Solar Resource Fraction (TSRF), a combined measure of irradiance availability and shading loss, for every panel.
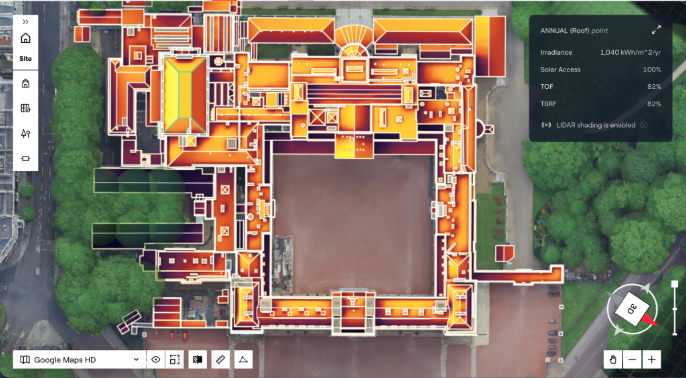
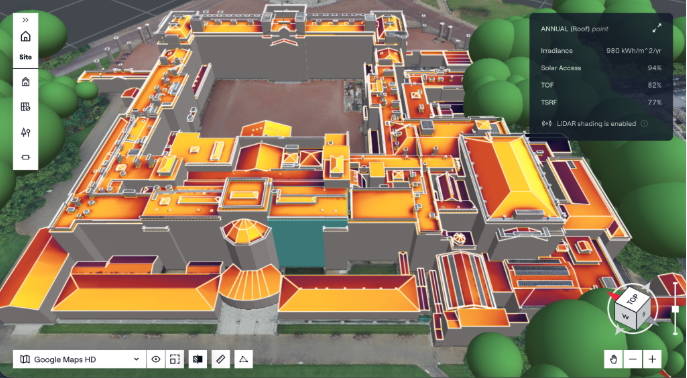
And the shading map tells a story we sort of expected: Large segments of the roof — particularly north-facing planes, areas behind chimneys and parapets, and sections close to the tree line — get a lot less sun. So, installing panels there just doesn’t make sense, for economic and performance reasons. After all, in a grid-connected system with no storage, heavily shaded strings can drag down the performance of adjacent panels through mismatch losses.
Step 5: The Optimised Design
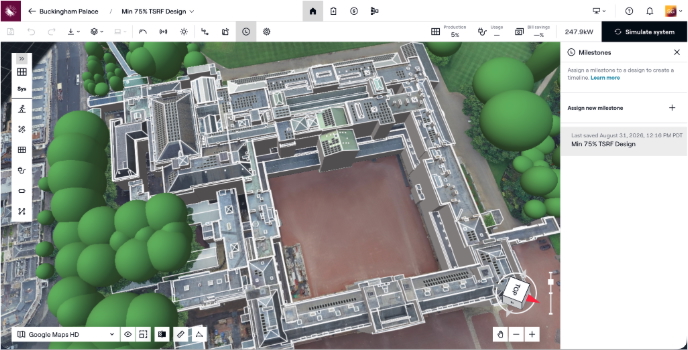
To keep things efficient, let’s apply a TSRF threshold of ≥75%. This removes all the panels where shading and irradiance losses are too high. We get a smaller, but far more viable, system.
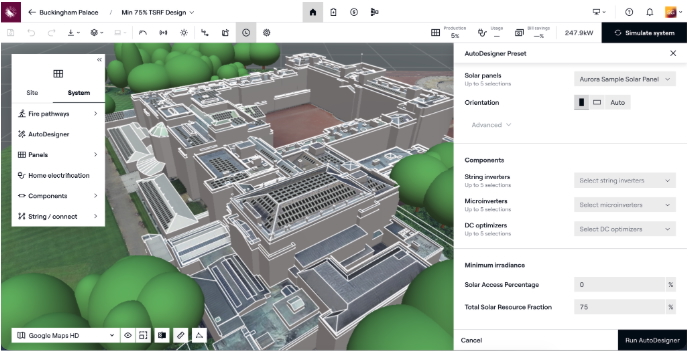
| Metric | Max fill design | Optimised design (TSRF ≥75%) |
| Panels | 4,605 | ~740 |
| System size | ~1.5 MW | ~250 kW |
| Reduction | — | 84% fewer panel |
Now, it’s important to understand that cutting 84% of the panels doesn’t mean the system is 84% less valuable. Every panel is producing near capacity, creating an efficient, economically viable system.
Step 6: The Verdict
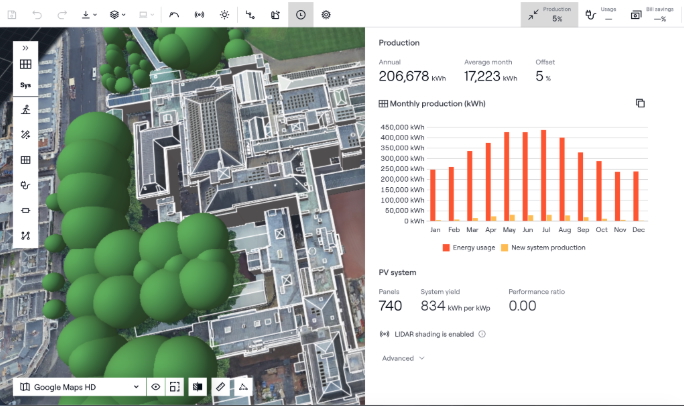
With the optimised 250 kW system modelled against UK irradiance data for central London (~1,000 kWh/m²/year, pretty standard for northern Europe), here’s what we get:
| Metric | Value |
| System size | ~250 kW |
| Annual production | ~206,678 kWh |
| Annual consumption | ~4.3M kWh |
| Offset | ~5% |
That’s a pretty nice system, until we get to the 5% offset. Woof. Obviously that’s not ideal for any solar install, but we can’t control how much electricity they use or the quirky roof. But, that in itself, is a valid conclusion. Without accurate solar software, we might’ve just tried that 1.5 MW install and nobody would be happy.
What This Means for Real-World Solar Design
Even with the modest offset, we think this install might be worth the positive PR and money saved anyway. But, we’re unapologetic solar advocates.
What we can see through this exercise is how important it is to have accurate measurements and projections. Back of the envelope, or designing in your favorite spreadsheet, often doesn’t get you the right answer. Without an accurate 3D model of each roof face, obstruction, and tree, it can be difficult to determine where panels could (or should) fit on the roof.
A few things Buckingham Palace reveals:
Fit ≠ performance. Yes, 4,605 panels can fit on the roof. But only 740 of them are worth installing. The quick accurate shading analysis really pulls its weight here.
TSRF for placement. A defined TSRF threshold can give designers a good baseline for where panels can be placed. And it’s one they can show clients in color, include in proposals, and stand behind.
Precision modelling to save time and trust. If you presented the king with a 1.5 MW system and he found out later it was performing like a 250 kW system, that wouldn’t be great. In real life, it could potentially end your relationship with the customer. If you go in with a 250 kW design and explain exactly why, that builds trust.
The tools make this scalable. The workflow here (SmartRoof + LIDAR + shading analysis) is the same basic structure you’d use for any site. Yes, we wanted to have a little fun with the palace (and we did!), but the methodology here can apply to almost any structure you’re trying to model.
Buckingham Palace is just the beginning. Stay tuned. In the coming weeks we’ll look at some other iconic structures from around the UK, and have some detailed posts about how to use Aurora in your business.
Until then, cheers!
Want to see for yourself? Schedule a no-pressure demo!
FAQ
Q: How much energy does Buckingham Palace use?
According to the Sovereign Grant Annual Report, Buckingham Palace consumes approximately 4.3 million kWh of electricity from the grid annually — more than 40% of the entire Royal Estate’s electricity usage, and equivalent to around 1,200 average UK homes.
Q: How many solar panels could Buckingham Palace fit on its roof?
A maximum panel layout places 4,605 panels across all available roof surfaces — a system of approximately 1.5 MW. However, once shading analysis is applied and panels are restricted to roof sections with a TSRF of 75% or higher, the realistic figure drops to around 740 panels (~250 kW).
Q: How much of Buckingham Palace’s electricity could solar supply?
An optimised 250 kW rooftop system would produce approximately 206,678 kWh per year — around 5% of the palace’s annual electricity consumption. The limited offset is partly a function of the roof geometry and partly a reflection of central London’s relatively low irradiance (~1,000 kWh/m²/year).
Q: What is TSRF and why does it matter for solar design?
TSRF (Total Solar Resource Fraction) is a metric that combines irradiance availability and shading losses to give a single measure of how productive a panel position will be relative to an unobstructed location. Using a TSRF threshold, such as ≥75%, lets designers filter out roof sections where shading losses make installation economically marginal. Aurora calculates TSRF for every panel position as part of its shading simulation.
Q: What is SmartRoof and how was it used here?
SmartRoof is Aurora’s roof modelling tool that automatically detects and maps roof planes from aerial imagery, then fits them to LIDAR elevation data for precise 3D geometry. For a complex multi-wing structure like Buckingham Palace, it generates an accurate model that would take hours to produce manually, and that accuracy is the foundation of reliable shading and production simulations.
Q: Does solar work well in the UK?
It works, although UK irradiance (roughly 900–1,100 kWh/m²/year depending on location) is lower than sunnier parts of Europe. That makes accurate design more important: Every panel needs to be earning its keep, which is exactly the argument for precision shading analysis and TSRF-based placement.
Sources: Sovereign Grant Annual Report (Buckingham Palace electricity consumption); Environment Agency National LIDAR Programme (roof elevation data); Aurora Solar simulation (production estimates, shading analysis).